
Amidst the uncertainty brought by COVID-19, the team at Inspired Intellect, under the direction of our Chief Data Scientist Brian Monteiro, PhD, initiated a data analytics project to help address the pandemic. We analyzed data across three tracks: quantitative forecasting, Twitter sentiment, and Research & Development studies. Our goal is to support front-line healthcare workers, healthcare product distributors, and pharmaceutical companies while showcasing our team’s expertise with turning data into actionable information. After aggregating the data, we discovered:
- Mobility and Airport locations have a high correlation to virus hotspot areas
- Personal Protection Equipment is a long-term trending topic of discussion on Twitter with opportunities for businesses to address shortfalls of equipment with donations and distribution expertise (search for “PPE Donation” on Twitter)
- R&D for virus vaccines is highly concentrated in the United States and China, while Italy and India continue to investigate best practices for containing the virus though other medical procedures continue
While this initiative was focused on healthcare and the COVID-19 pandemic, our methodology can be applied to address issues in several other industries. For more on how these insights were generated within each track, the following sections contain data and charts that led to their discovery.
Research & Development Navigation
The World Health Organization (WHO) maintains a database that stores references to research papers focused on the Coronavirus pandemic. It is a CSV file that lists the title, authors, an abstract, and, most importantly, Document Object Identifiers (DOIs) for each paper. This database is an attempt to aggregate global C19 research efforts so that the world may better collaborate on discoveries and treatments and ultimately accelerate the process of finding a cure.
When first downloading the CSV file on May 12, it contained over 16K papers. To run meaningful analytics, the most useful data point across these documents is the DOI.
DOI example: “10.1001/amajethics.2020.344” – “Cohesion in Distancing”
With this unique code, I was able to enrich the data set with information from other data sources on authors, cover dates, and hyperlinks for each paper. For example, the CSV file doesn’t contain a URL address linked to research papers. Using a REST API from DOI.org, I was able to find a hyperlink on the web to read the papers. I used another service to find information about authors, their affiliations, and the cover date related to the associated journal.
Once the data was enriched, I set up boundaries and dimensions for exploring the data, yielding this interesting timeline on publication.
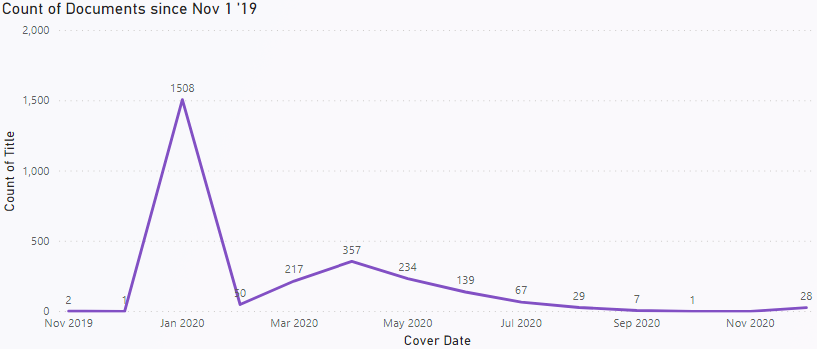
It is interesting to note the extent of papers published in January of 2020, despite the fact that the WHO did not declare C19 a pandemic until March 11, 2020. Around 48% of those papers are from China and the United States.
You can see a long tail on this timeline, representing a sustained interest from researchers on the topic, and it will most likely continue in this manner until a vaccine is discovered.
For reference, the enriched data looks like the table shown below.
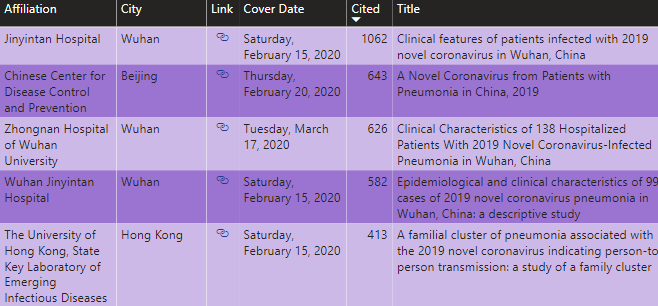
Enriching the data enables several intriguing navigation scenarios, such as developing the timeline shown above or segmenting by geography.
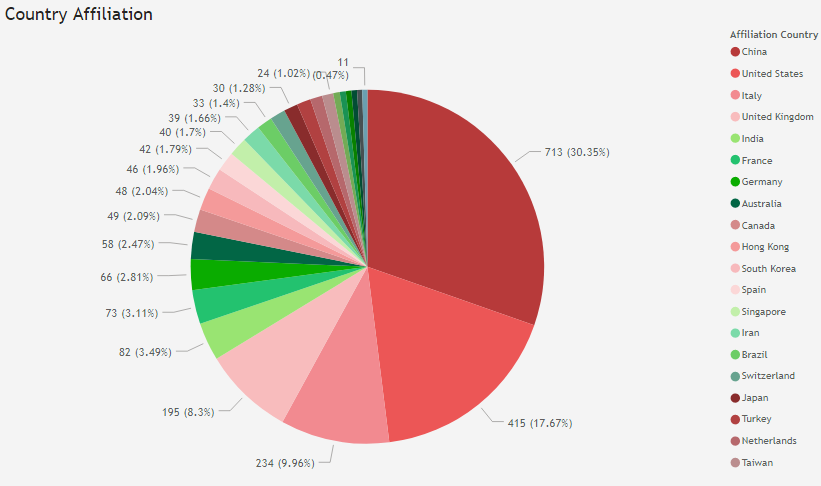
As one might expect, China, as ground zero for the outbreak, makes up a significant majority of research papers published.
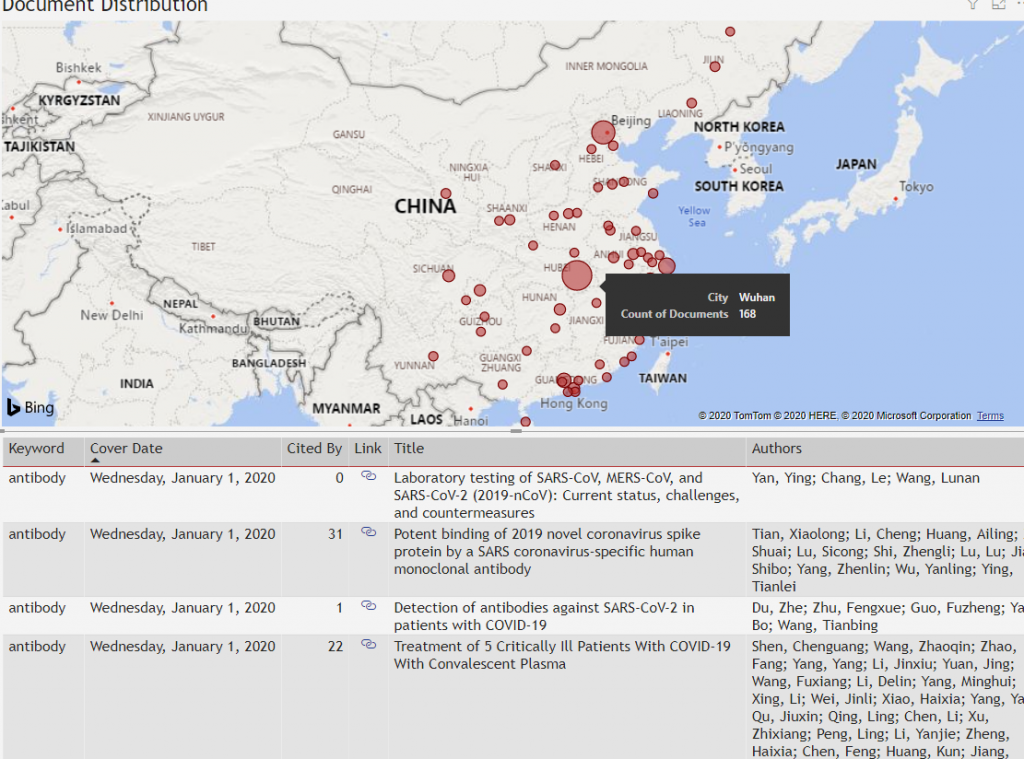
When looking into China with greater granularity, we see that the epicenter, Wuhan, has 168 research papers published about the virus.
Finally, the enriched data set contains a metric denoted “Cited By”. Like “upvoting” in popular forums, this measurement indicates a value associated with a paper. It means that people are reading this paper and actually “citing” it in other research.
During my analysis, I discovered several keywords popular in the abstracts. Using keywords, along with “Cited By” metrics, I built the navigational tool shown below. The small pink bubble on the top left indicates that there is one research paper that has been cited 1,062 times and contains the keyword “treatment”.
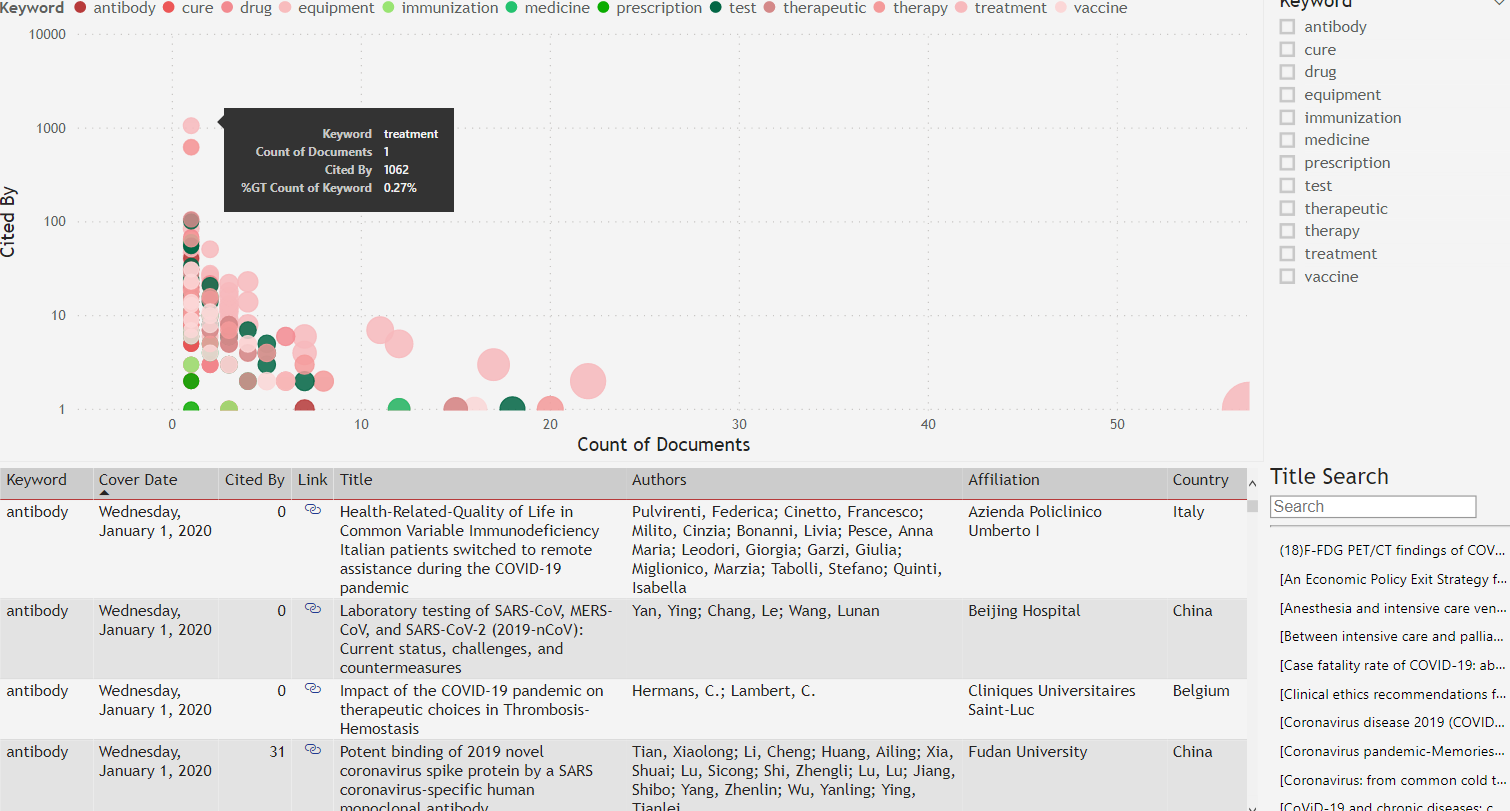
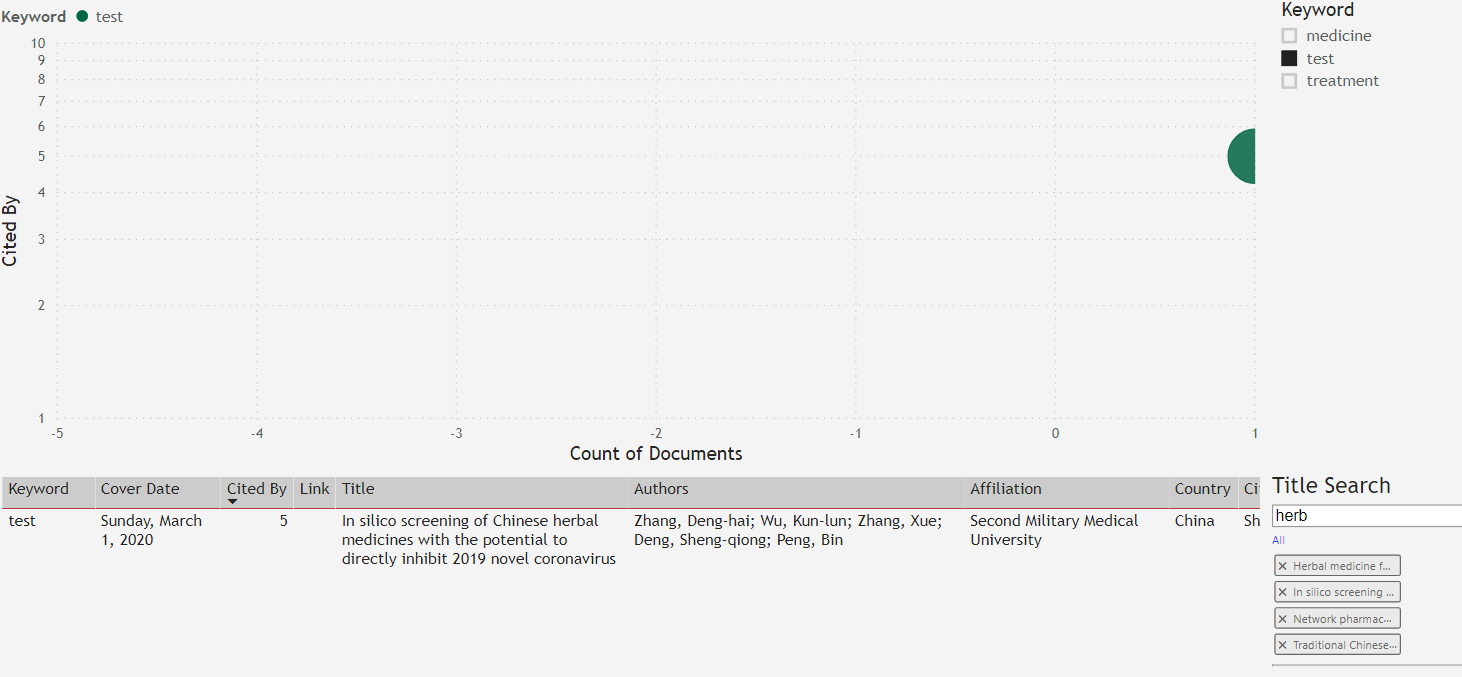
You could use this interface to pick keyword(s), select high performing papers that have been heavily cited, and then be more specific using a title search. As an example, four research papers contain the word “herb” in the title, and one has been “Cited by” 5 times with the keyword “test”.
Beneficiaries of these Insights
With these tools, we identified patterns across Research & Development papers that could triangulate useful information to enable patient treatment and cure discovery. These tools are engineered to serve the following parties:
Frontline Workers
These research papers contain information for healthcare workers looking for therapy best practices, along with promising vaccine treatments. A colleague recently told me that his spouse, who is a caregiver, spends hours each night reading papers to understand how best to treat patients. By setting up navigation scenarios, combined with search capabilities, front-line workers can quickly identify emerging trends and navigate a wealth of information, segmented by content type.
Pharmaceutical Companies
This information can bridge silos among global pharmaceutical companies. It encourages collaboration where teams of researchers could combine efforts to quickly produce a vaccine. The data contains information on equipment suggestions for hospitals and pharmacies. The lack of personal protection equipment has been a significant supply chain issue in the United States and some of these research papers list helpful products that pharmacies should stock to better prepare for future outbreaks.
As a quick note on methodology, enabling people of different interests to sift through all these research papers to find actionable information is the goal for enriching the data and thinking about potential navigation scenarios. You could simply put this data into a search engine and have a text box as the only interface. I wanted to make it more of a guided navigational and data discovery experience by thinking of boundaries such as timeline, geography, authors, keywords, and “Cited by” metrics.
The navigation dashboards were made with Microsoft Power BI and it is exposed on the public web. Anyone can use the tool and explore the data. R&D Navigation
Twitter Sentiment Analysis
For our second analytics track, we tapped into the wisdom of the crowds by leveraging Social Media. To derive insights, we focused on Twitter by analyzing tweets for trending hashtags, sentiment analysis, and user network effects. We used Twitter’s public API and focused on three distinct topics:
- COVID-19
- Distributor
- Manufacturer.
Over the course of 26 days, we analyzed 1.8M tweets and 110,000 unique hashtags. There are approximately 500M tweets on Twitter per day. While this is a small sample, it does reveal important trends.
To ascertain the critical mass and momentum of a trending topic, we calculated the slope of individual hashtags and focused on hashtags with greater than 100 observations and a slope greater than 10. These boundaries reduced the number of hashtags we analyzed from 110,000 to 17.
Below is a screenshot with three popular hashtags highlighted:
- #PPE
- #Hydroxychloroquine
- #lockdown.
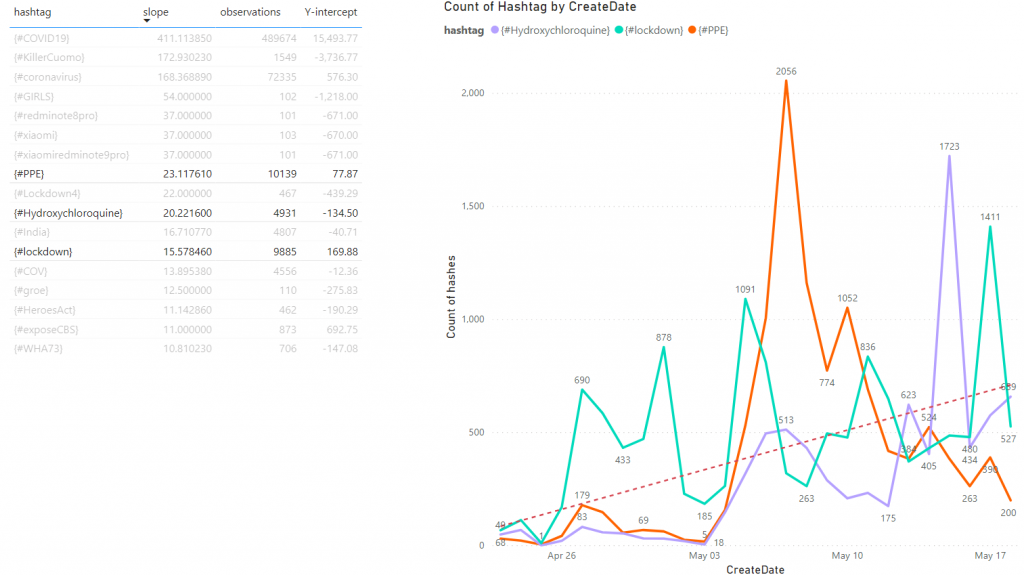
The positive slope generated by thousands of observations indicates a long-term trend. Most hashtags on Twitter are short-lived. So while hashtags bubble up and become popular quickly, they can also disappear quickly. Conversely, we used the parameters above to find a valuable signal with these points.
While the above topics exhibited tenure among the general public, we were also able to ascertain which topics were temporal in the C19 race for a cure. Using the following charts, compare the above trends to the negative slope generated by the following hashtags, which visibly fell out of favor:
- #Covidtracking
- #lockdown4guidelines
- #chloroquin
- #ENECOVID.
Using #chloroquin as an example, we can see a pattern where a potential C19 silver bullet fell out of favor with the scientific community and lost momentum in the general public. We can also compare this to the rise of hydroxychloroquine, which has a sustained interest in both the scientific and global community as a potential treatment.
The team analyzing Twitter data is working on a detailed paper for their findings and plan to publish their report over the next few weeks. Look for more insights into how analyzing Twitter with keywords, hashtags, and user analytics can benefit any business trying to meet demand and realize opportunities through the immediacy of this social network.
Quantitative Analysis and Risk Score
The final analytic opportunity targeted understanding factors that contributed to the rapid migration of the pandemic. This research is useful to public health policy administrators, healthcare providers and pharmaceuticals suppliers (wholesalers and manufacturers alike), all seeking to mitigate expansion while also distributing equipment to meet dynamic needs. Employing machine learning against a variety of externally sourced data assets ranging from COVID-19 infection and mortality statistics and health equity data attributes, to county level mobility and airport data, our resultant model was highly correlated with the COVID-19 migration.
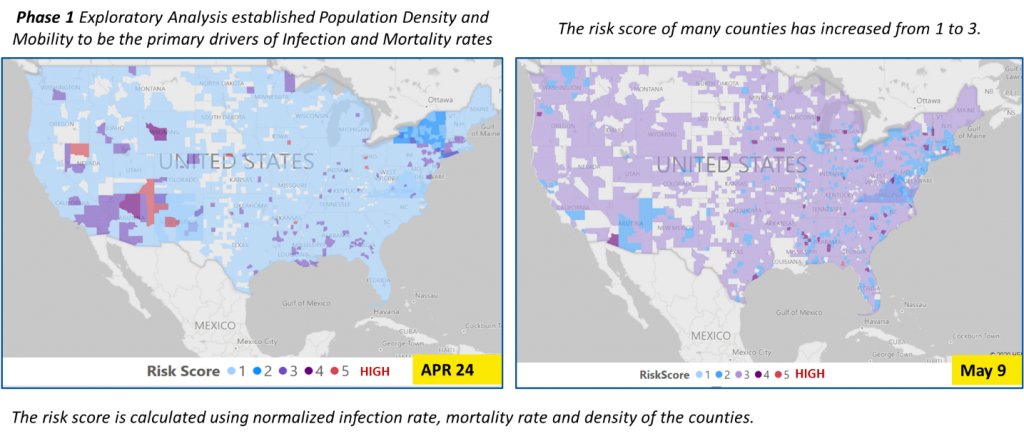
The charts above illustrate the outcomes produced by our models, showcasing how our model closely replicated actual migration behaviors of COVID-19. Regions that were high-risk (as of Apr 24) had declined in severity by May 9, while other regions that were previously lower risk, increased in severity over time.
Follow our series of blog posts on our COVID-19 study to learn more about the insights we garnered while developing the machine learning models.
Final Considerations
The COVID-19 pandemic has captured the attention of the entire world. The concerted response of global organizations and citizens is equally unprecedented. With the incredible resources dedicated to finding a cure, it is possible to pool these data assets to leverage the work being performed across the world and develop meaningful applications. Using this data, we can predict infection hotspots and key indicators that contribute to its spread, such as “mobility”. We can also analyze R&D studies to find promising therapies and equipment to help patients. Lastly, we can analyze sentiment in real-time on Twitter and triangulate trends and needs to specific geographical locations and determine whether there are any remediations to help, such as donating personal protection equipment locally.
We have an opportunity to set a historical precedent on how we use technology to collaborate on solutions and potential remedies. As a global society, we can address and mitigate the risks of infection and death while examining events at both the local and global levels. At Inspired Intellect, we are leveraging our deep data and analytics expertise to develop a meaningful solution for our global stakeholders. Our team has a wide breadth of understanding of technology tools to develop and deliver data assets that generate insights akin to those generated in this article. There are many ways that we all can contribute to addressing this global pandemic, even if it is simply wearing a mask or “staying at home”. At Inspired Intellect, we wanted to use analytics to support the decisions made by those taking this disease head-on.
Watch for more in the coming weeks explaining the Machine Learning for our hotspot forecasting model along with a more in-depth discussion on Twitter insights.
Methodology, Technology and Data
This project was focused on healthcare and the COVID-19 pandemic, but our methodology is like other projects completed in various other industries. In summary, we:
- Searched and found datasets
- Enriched data with several complementary data services
- Transformed and loaded enriched data in multiple database technologies
- Explored the data
- Developed navigational tools, along with predictive algorithms for future observations
- Automated the entire process while paying attention to future data changes (also referred to as Change Data Capture)
- Deployed all code assets to the cloud
For this project, we developed and reused Java code assets to make REST calls to open data sources. The REST call responses were in JSON format and that format was perfect for storing data in a NoSQL database. We used Couchbase because of the advanced SQL query language for JSON called N1QL. Couchbase, along with the Spark connector enabled quick keyword analysis for the R&D papers. The Couchbase Full-Text Search capability enabled us to quickly assign keyword flags to specific articles and surface this analysis in Power BI.
For other quantitative data sources, such as infection rates, the format was in a CSV file. For this data, we used a Postgres traditional ER database. The machine learning models, along with some data preparation code assets, were built in Juniper notebooks and Python.
All our code assets and databases were stored on an Amazon AWS Free Tier cluster. The hardware costs were minimum because we leveraged AWS Free Tier machines and only had to pay for storage. The Power BI reports are stored on Microsoft’s cloud and we have a 60-day free time limit on using that resource. Power BI connects to the AWS databases and refreshes the dashboards frequently.
Company Description
Inspired Intellect is an end-to-end service provider of data management, analytics and application development. We engage through a portfolio of offerings ranging from strategic advisory and design, to development and deployment, through to sustained operations and managed services.
Inspired Intellect is part of the ADI Group. The ADI Group is a collection of companies that, collectively, advises on and implements enhanced technological capabilities for enterprises along their digital transformation journey. Members of the ADI Group include:
- Worldlink
- Inspired Intellect
- ADI Family Office
- The ADI Foundation
Inspired Intellect’s membership in the ADI Group allows its clients access to a broader portfolio of digital transformation solutions and multiple touch points with innovation